kotlin-statistics alternatives and similar libraries
Based on the "Data Science" category.
Alternatively, view kotlin-statistics alternatives based on common mentions on social networks and blogs.
-
-
optaplanner
Java Constraint Solver to solve vehicle routing, employee rostering, task assignment, maintenance scheduling, conference scheduling and other planning problems. -
pairAdjacentViolators
A JVM implementation of the Pair Adjacent Violators algorithm for isotonic regression

WorkOS - The modern identity platform for B2B SaaS


* Code Quality Rankings and insights are calculated and provided by Lumnify.
They vary from L1 to L5 with "L5" being the highest.
Do you think we are missing an alternative of kotlin-statistics or a related project?


README

Kotlin Statistics
NOTE: UNSUPPORTED. PLEASE FORK AND SUPPORT.
Idiomatic math and statistical extensions for Kotlin

This library contains helpful extension functions to perform exploratory and production statistics in a Kotlin-idiomatic way.
Read the introductory blog post here
Community
Join the #datscience community on Kotlin Slack for community discussion on this library as well as Kotlin for data science.
Build Instructions
You can use Gradle or Maven to pull the latest release from Maven.
Gradle
dependencies {
    compile 'org.nield:kotlin-statistics:1.2.1'
}
Maven
<dependency>
    <groupId>org.nield</groupId>
    <artifactId>kotlin-statistics</artifactId>
    <version>1.2.1</version>
</dependency>
You can also use Maven or Gradle with JitPack to directly build a snapshot as a dependency.
Gradle
repositories {
    maven { url 'https://jitpack.io' }
}
dependencies {
    compile 'com.github.thomasnield:kotlin-statistics:-SNAPSHOT'
}
Maven
<repositories>
    <repository>
        <id>jitpack.io</id>
        <url>https://jitpack.io</url>
    </repository>
</repositories>
<dependency>
    <groupId>com.github.thomasnield</groupId>
    <artifactId>kotlin-statistics</artifactId>
    <version>-SNAPSHOT</version>
</dependency>
Kotlin-Statistics at KotlinConf


Basic Operators
There are a number of extension function operators that support Int, Long, Double, Float, BigDecimal and Short numeric types for Sequences, Arrays, and Iterables:
- descriptiveStatistics
- sum()
- average()
- min()
- max()
- mode()
- median()
- range()
- percentile()
- variance()
- standardDeviation()
- geometricMean()
- sumOfSquares()
- normalize()
- simpleRegression()
- kurtosis
- skewness
Here is an example of using the median() extension function against a Sequence of Doubles:
val median = sequenceOf(1.0, 3.0, 5.0).median()
println(median) // prints "3.0"
Slicing Operators
There are also simple but powerful xxxBy() operators that allow you slice many of these statistical operators on a given key:
- countBy()
- sumBy()
- averageBy()
- geometricMeanBy()
- minBy()
- maxBy()
- rangeBy()
- varianceBy()
- standardDeviationBy()
- descriptiveStatisticsBy()
- simpleRegressionBy()
Below, we slice a sequence of Item objects by their lengths and get the averages and standard deviations by each length.
class Item(val name: String, val value: Double)

val sequence = sequenceOf(
        Item("Alpha", 4.0),
        Item("Beta", 6.0),
        Item("Gamma", 7.2),
        Item("Delta", 9.2),
        Item("Epsilon", 6.8),
        Item("Zeta", 2.4),
        Item("Iota", 8.8)
)

// find sums by name length, using pairs or functional arguments
val sumsByLengths = sequence
       .map { it.name.length to it.value }
       .sumBy()

val sumsByLengths = sequence
       .sumBy(keySelector = { it.name.length }, doubleSelector = {it.value} )

println("Sums by lengths: $sumsByLengths")

// find averages by name length, using pairs or functional arguments

val averagesByLength = sequence
        .map { it.name.length to it.value }
        .averageBy()

val averagesByLength = sequence
        .averageBy(keySelector = { it.name.length }, doubleSelector = {it.value})


//find standard deviations by name length, using pairs or functional arguments

val standardDeviationsByLength = sequence
        .map { it.name.length to it.value }
        .standardDeviationBy()

val standardDeviationsByLength = sequence
        .standardDeviationBy(keySelector = { it.name.length }, valueSelector = {it.value})

println("Std Devs by lengths: $standardDeviationsByLength")
OUTPUT:
Sums by lengths: {5=20.4, 4=17.200000000000003, 7=6.8}
Averages by lengths: {5=6.8, 4=5.733333333333334, 7=6.8}
Std Devs by lengths: {5=2.1416504538945342, 4=2.619584360585134, 7=0.0}
These slicing operators are backed by a common groupApply() function, which can be used to implement other slicing operators easily.
Slicing Using Data Classes
You can slice on multiple fields using data classes with the xxxBy() operators as well. This is similar to using a GROUP BY on multiple fields in SQL. Below we slice a count and average defect of products by their category and section.
//declare Product class
class Product(val id: Int,
              val name: String,
              val category: String,
              val section: Int,
              val defectRate: Double)

// Create list of Products
val products = listOf(Product(1, "Rayzeon", "ABR", 3, 1.1),
        Product(2, "ZenFire", "ABZ", 4, 0.7),
        Product(3, "HydroFlux", "ABR", 3, 1.9),
        Product(4, "IceFlyer", "ZBN", 1, 2.4),
        Product(5, "FireCoyote", "ABZ", 4, 3.2),
        Product(6, "LightFiber", "ABZ",2,  5.1),
        Product(7, "PyroKit", "ABR", 3, 1.4),
        Product(8, "BladeKit", "ZBN", 1, 0.5),
        Product(9, "NightHawk", "ZBN", 1, 3.5),
        Product(10, "NoctoSquirrel", "ABR", 2, 1.1),
        Product(11, "WolverinePack", "ABR", 3, 1.2)
        )

// Data Class for Grouping
data class Key(val category: String, val section: Int)

// Get Count by Category and Section
val countByCategoryAndSection =
        products.countBy { Key(it.category, it.section) }

println("Counts by Category and Section")
countByCategoryAndSection.entries.forEach { println(it) }

// Get Average Defect Rate by Category and Section
val averageDefectByCategoryAndSection =
        products.averageBy(keySelector = { Key(it.category, it.section) }, doubleSelector = { it.defectRate })

println("\nAverage Defect Rate by Category and Section")
averageDefectByCategoryAndSection.entries.forEach { println(it) }
OUTPUT:
Counts by Category and Section
Key(category=ABR, section=3)=4
Key(category=ABZ, section=4)=2
Key(category=ZBN, section=1)=3
Key(category=ABZ, section=2)=1
Key(category=ABR, section=2)=1

Average Defect Rate by Category and Section
Key(category=ABR, section=3)=1.4000000000000001
Key(category=ABZ, section=4)=1.9500000000000002
Key(category=ZBN, section=1)=2.1333333333333333
Key(category=ABZ, section=2)=5.1
Key(category=ABR, section=2)=1.1
Slicing by Ranges/Bins
You can also group by ranges (or known in statistics as "bins" or a "histogram").
Please note that in Kotlin-Statistics 1.2, the
gapSizeparameter was removed from allbinBy()extension functions. ARangeinterface was implemented to accomodate aClosedOpenRangeneeded for binning operations. Hopefully Kotlin will officially support different open range implementations and Kotlin-Statistics can migrate to them.
Slicing By Numbers
There are specialized bin operators that deal with numeric ranges for Int, Long, Double, Float, and BigDecimal. Below, we bin the sales items by increments of 20.0 for the value.
import java.time.LocalDate

fun main(args: Array<String>) {

    data class Sale(val accountId: Int, val date: LocalDate, val value: Double)

    val sales = listOf(
            Sale(1, LocalDate.of(2016,12,3), 180.0),
            Sale(2, LocalDate.of(2016, 7, 4), 140.2),
            Sale(3, LocalDate.of(2016, 6, 3), 111.4),
            Sale(4, LocalDate.of(2016, 1, 5), 192.7),
            Sale(5, LocalDate.of(2016, 5, 4), 137.9),
            Sale(6, LocalDate.of(2016, 3, 6), 125.6),
            Sale(7, LocalDate.of(2016, 12,4), 164.3),
            Sale(8, LocalDate.of(2016, 7,11), 144.2)
            )

    //bin by double ranges
    val binned = sales.binByDouble(
            valueSelector = { it.value },
            binSize = 20.0,
            rangeStart = 100.0
    )

    binned.forEach(::println)
}
OUTPUT:
Bin(range=[100.0..120.0), value=[Sale(accountId=3, date=2016-06-03, value=111.4)])
Bin(range=[120.0..140.0), value=[Sale(accountId=5, date=2016-05-04, value=137.9), Sale(accountId=6, date=2016-03-06, value=125.6)])
Bin(range=[140.0..160.0), value=[Sale(accountId=2, date=2016-07-04, value=140.2), Sale(accountId=8, date=2016-07-11, value=144.2)])
Bin(range=[160.0..180.0), value=[Sale(accountId=7, date=2016-12-04, value=164.3)])
Bin(range=[180.0..200.0), value=[Sale(accountId=1, date=2016-12-03, value=180.0), Sale(accountId=4, date=2016-01-05, value=192.7)])
Slicing by Comparables
You can group any T items into bins composed of Comparable ranges. Below, we group up items by yearly quarters by mapping each item to a Month, and then setting the binSize to 3. We also have to provide an incrementer so the model knows how to build the bins incrementally.
import java.time.LocalDate

fun main(args: Array<String>) {

    data class Sale(val accountId: Int, val date: LocalDate, val value: Double)

    val sales = listOf(
            Sale(1, LocalDate.of(2016,12,3), 180.0),
            Sale(2, LocalDate.of(2016, 7, 4), 140.2),
            Sale(3, LocalDate.of(2016, 6, 3), 111.4),
            Sale(4, LocalDate.of(2016, 1, 5), 192.7),
            Sale(5, LocalDate.of(2016, 5, 4), 137.9),
            Sale(6, LocalDate.of(2016, 3, 6), 125.6),
            Sale(7, LocalDate.of(2016, 12,4), 164.3),
            Sale(8, LocalDate.of(2016, 7,11), 144.2)
            )

    //bin by quarter
    val byQuarter = sales.binByComparable(
            valueSelector = { it.date.month },
            binIncrements = 3,
            incrementer = { it.plus(1L) }
    )

    byQuarter.forEach(::println)
}
OUTPUT:
Bin(range=JANUARY..MARCH, value=[Sale(accountId=4, date=2016-01-05, value=192.7), Sale(accountId=6, date=2016-03-06, value=125.6)])
Bin(range=APRIL..JUNE, value=[Sale(accountId=3, date=2016-06-03, value=111.4), Sale(accountId=5, date=2016-05-04, value=137.9)])
Bin(range=JULY..SEPTEMBER, value=[Sale(accountId=2, date=2016-07-04, value=140.2), Sale(accountId=8, date=2016-07-11, value=144.2)])
Bin(range=OCTOBER..DECEMBER, value=[Sale(accountId=1, date=2016-12-03, value=180.0), Sale(accountId=7, date=2016-12-04, value=164.3)])
Custom Binning Operations
If you want to perform a mathematical aggregation on a certain property for each item (rather than group up the items into a List for a given bin), provide a groupOp argument specifying how to calculate a value on each grouping. Below, we find the sum of values by quarter.
import java.time.LocalDate

fun main(args: Array<String>) {

    data class Sale(val accountId: Int, val date: LocalDate, val value: Double)

    val sales = listOf(
            Sale(1, LocalDate.of(2016,12,3), 180.0),
            Sale(2, LocalDate.of(2016, 7, 4), 140.2),
            Sale(3, LocalDate.of(2016, 6, 3), 111.4),
            Sale(4, LocalDate.of(2016, 1, 5), 192.7),
            Sale(5, LocalDate.of(2016, 5, 4), 137.9),
            Sale(6, LocalDate.of(2016, 3, 6), 125.6),
            Sale(7, LocalDate.of(2016, 12,4), 164.3),
            Sale(8, LocalDate.of(2016, 7,11), 144.2)
    )

    //bin sums by quarter
    val totalValueByQuarter = sales.binByComparable(
            valueSelector = { it.date.month },
            binIncrements = 3,
            incrementer = { it.plus(1L) },
            groupOp = { it.map(Sale::value).sum() }
    )

    totalValueByQuarter.forEach(::println)
}
OUTPUT:
Bin(range=JANUARY..MARCH, value=318.29999999999995)
Bin(range=APRIL..JUNE, value=249.3)
Bin(range=JULY..SEPTEMBER, value=284.4)
Bin(range=OCTOBER..DECEMBER, value=344.3)
Random Selection
Kotlin-Statistics has a few helpful extensions to randomly sample elements from an Iterable<T> or Sequence<T>.
randomFirst()- Selects one random element but throws an error if no elements are found.randomFirstOrNull()- Selects one random element but returnsnullif no elements are found.random(n: Int)- Selectsnrandom elements.randomDistinct(n: Int)- Selectndistinct random elements.
Weighted Coin/Dice - Discrete PDF Sampling
Rather than do a pure random sampling, there may be times you want different values of type T to be assigned different probabilities, and then you want to sample a T randomly given those probabilities. This can be helpful for creating simulations or stochastic algorithms in general.
The WeightedCoin and WeightedDice assist in these purposes.
A WeightedCoin accepts a trueProbability from 0.0 to 1.0. If we provide a probability of .80, the coin will flip approximately 80% of the time to be true.
val riggedCoin = WeightedCoin(trueProbability = .80)

// flip coin 100000 times and print outcome counts
(1..100000).asSequence().map { riggedCoin.flip() }
        .countBy()
        .also {
            println(it)
        }
OUTPUT:
{false=20033, true=79967}
You can use the WeightedDice to manage outcomes mapped to any type T. For instance, if we have a dice with sides "A", "B", and "C" with probability outcomes .11, .66, and .22, we can create a WeightedDice effectively like this:
    val threeSidedDice = WeightedDice(
            "A" to .11,
            "B" to .66,
            "C" to .22
    )

    // roll dice 1000 times and print outcome counts
    (1..1000).asSequence().map { threeSidedDice.roll() }
            .countBy()
            .also {
                println(it)
            }
OUTPUT:
{B=682, C=202, A=116}
Typically with WeightedDice, you may likely use an enumerable to assign outcome probabilites to discrete items:
enum class Move {
    ATTACK,
    DEFEND,
    HEAL,
    RETREAT
}

fun main(args: Array<String>) {

    val gameDice = WeightedDice(
            Move.ATTACK to .60,
            Move.DEFEND to .20,
            Move.HEAL to .10,
            Move.RETREAT to .10
    )

    val nextMove = gameDice.roll()

    println(nextMove)
}
Naive Bayes Classifier
The NaiveBayesClassifier does a simple but powerful form of machine learning. For a given set of T items, you can extract one or more F features and associate a category C.
You can then test a new set of features F and predict a category C.
For instance, say you want to identify email as spam/not spam based on the words in the messages. In this case true (spam) or false (not spam) will be the possible categories, and each word will be a feature.
In idiomatic Kotlin fashion we can take a simple List<Email> and call toNaiveBayesClassifier(), provide the higher-order functions to extract the features and category, and then generate a model.
class Email(val message: String, val isSpam: Boolean)

val emails = listOf(
        Email("Hey there! I thought you might find this interesting. Click here.", isSpam = true),
        Email("Get viagra for a discount as much as 90%", isSpam = true),
        Email("Viagra prescription for less", isSpam = true),
        Email("Even better than Viagra, try this new prescription drug", isSpam = true),

        Email("Hey, I left my phone at home. Email me if you need anything. I'll be in a meeting for the afternoon.", isSpam = false),
        Email("Please see attachment for notes on today's meeting. Interesting findings on your market research.", isSpam = false),
        Email("An item on your Amazon wish list received a discount", isSpam = false),
        Email("Your prescription drug order is ready", isSpam = false),
        Email("Your Amazon account password has been reset", isSpam = false),
        Email("Your Amazon order", isSpam = false)
)

val nbc = emails.toNaiveBayesClassifier(
        featuresSelector = { it.message.splitWords().toSet() },
        categorySelector = {it.isSpam }
)


fun String.splitWords() =  split(Regex("\\s")).asSequence()
         .map { it.replace(Regex("[^A-Za-z]"),"").toLowerCase() }
         .filter { it.isNotEmpty() }
We can then use this NaiveBayesClassifier model to predict the spamminess of new emails.
 // TEST 1
val input = "discount viagra wholesale, hurry while this offer lasts".splitWords().toSet()
val predictedCategory = nbc.predict(input)
Assert.assertTrue(predictedCategory == true)

// TEST 2
val input2 = "interesting meeting on amazon cloud services discount program".splitWords().toSet()
val predictedCategory2 = nbc.predict(input2)
Assert.assertTrue(predictedCategory2 == false)
Here is another example that categorizes bank transactions.
class BankTransaction(
        val date: LocalDate,
        val amount: Double,
        val memo: String,
        val category: String? = null
)

val bankTransactions = listOf(
        BankTransaction(date = LocalDate.of(2018,3,13),
                amount = 12.69,
                memo = "WHOLEFDS HPK 10140",
                category = "GROCERY"
        ),
        BankTransaction(date = LocalDate.of(2018,3,13),
                amount = 4.64,
                memo = "BIGGBY COFFEE #370",
                category = "COFFEE"
        ),
        BankTransaction(date = LocalDate.of(2018,3,13),
                amount = 14.23,
                memo = "AMAZON SALE",
                category = "ELECTRONICS"
        ),
        BankTransaction(date = LocalDate.of(2018,3,13),
                amount = 7.99,
                memo = "AMAZON KINDLE EBOOK SALE",
                category = "BOOK"
        ),
        BankTransaction(date = LocalDate.of(2018,3,10),
                amount = 5.40,
                memo = "AMAZON VIDEO ON DEMAND",
                category = "ENTERTAINMENT"
        ),
        BankTransaction(date = LocalDate.of(2018,3,10),
                amount = 61.27,
                memo = "WHOLEFDS PLN 10030",
                category = "GROCERY"
        ),
        BankTransaction(date = LocalDate.of(2018,3,12),
                amount = 61.27,
                memo = "STARBUCKS COFFEE #370",
                category = "COFFEE"
        ),
        BankTransaction(date = LocalDate.of(2018,3,7),
                amount = 2.29,
                memo = "REDBOX VIDEO RENTAL #271",
                category = "ENTERTAINMENT"
        )
)

val nbc = bankTransactions.toNaiveBayesClassifier(
        featuresSelector = { it.memo.splitWords().toSet() },
        categorySelector = { it.category!! }
)

// TEST 1
val input1 = BankTransaction(date = LocalDate.of(2018,3,31),
        amount = 13.99,
        memo = "NETFLIX VIDEO ON DEMAND #21"
)

val result1 = nbc.predictWithProbability(input1.memo.splitWords().toSet())
Assert.assertTrue(result1?.category == "ENTERTAINMENT")


// TEST 2
val input2 = BankTransaction(date = LocalDate.of(2018,3,6),
        amount = 17.21,
        memo = "FROGG COFFEE BAR AND CREPERIE"
)

val result2 = nbc.predictWithProbability(input2.memo.splitWords().toSet())
Assert.assertTrue(result2?.category == "COFFEE")
If you want to add more observations to your Naive Bayes model, just call addObservation() and it will update its probability model.
val nbc = NaiveBayesClassifier<String,String>()
nbc.addObservation("GROCERY", "COSTCO WHOLESALE #545".splitWords().toSet())
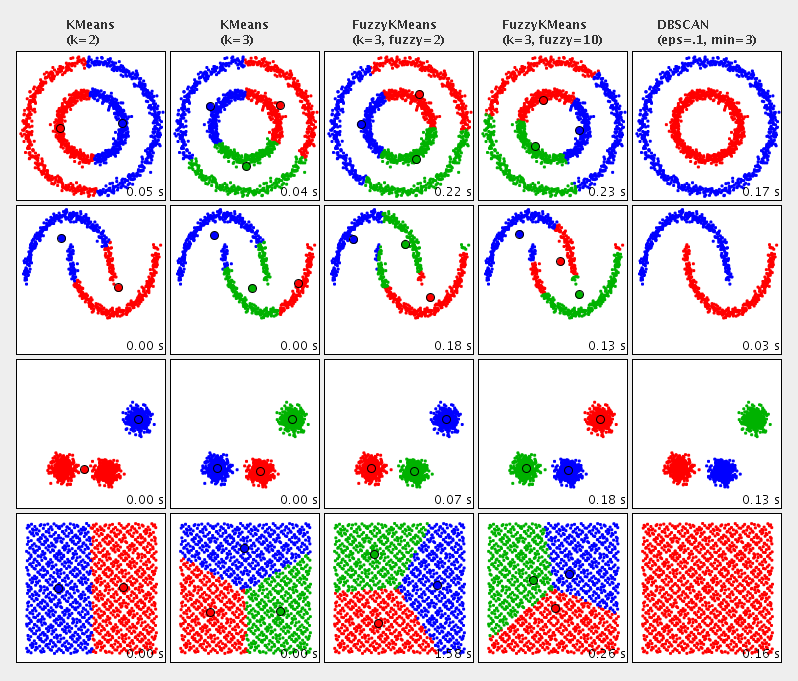
Clustering
There are a few clustering algorithms available in Kotlin-Statistics. These algorithms attempt to group up items that are closely related based on their proximity on a 2-dimensional plot. Currently there are three methods of clustering available that are implemented with Apache Commons Math
- KMeans
- Fuzzy-KMeans
- Multi-KMeans
- DBSCAN
Below, we cluster Patients by their age and white blood cell count. Note that the xSelector and ySelector arguments currently must map to a numeric type.
import java.time.LocalDate
import java.time.temporal.ChronoUnit

fun main(args: Array<String>) {

    //cluster patients by age and white blood cell count
    val clusters =  patients.multiKMeansCluster(k = 3,
                maxIterations = 10000,
                trialCount = 50,
                xSelector = { it.age.toDouble() },
                ySelector = { it.whiteBloodCellCount.toDouble() }
            )

    // print out the clusters
    clusters.forEachIndexed { index, item ->
        println("CENTROID: $index")
        item.points.forEach {
            println("\t$it")
        }
    }
}


data class Patient(val firstName: String,
                   val lastName: String,
                   val gender: Gender,
                   val birthday: LocalDate,
                   val whiteBloodCellCount: Int)  {

    val age = ChronoUnit.YEARS.between(birthday, LocalDate.now())
}

val patients = listOf(
        Patient("John", "Simone", Gender.MALE, LocalDate.of(1989, 1, 7), 4500),
        Patient("Sarah", "Marley", Gender.FEMALE, LocalDate.of(1970, 2, 5), 6700),
        Patient("Jessica", "Arnold", Gender.FEMALE, LocalDate.of(1980, 3, 9), 3400),
        Patient("Sam", "Beasley", Gender.MALE, LocalDate.of(1981, 4, 17), 8800),
        Patient("Dan", "Forney", Gender.MALE, LocalDate.of(1985, 9, 13), 5400),
        Patient("Lauren", "Michaels", Gender.FEMALE, LocalDate.of(1975, 8, 21), 5000),
        Patient("Michael", "Erlich", Gender.MALE, LocalDate.of(1985, 12, 17), 4100),
        Patient("Jason", "Miles", Gender.MALE, LocalDate.of(1991, 11, 1), 3900),
        Patient("Rebekah", "Earley", Gender.FEMALE, LocalDate.of(1985, 2, 18), 4600),
        Patient("James", "Larson", Gender.MALE, LocalDate.of(1974, 4, 10), 5100),
        Patient("Dan", "Ulrech", Gender.MALE, LocalDate.of(1991, 7, 11), 6000),
        Patient("Heather", "Eisner", Gender.FEMALE, LocalDate.of(1994, 3, 6), 6000),
        Patient("Jasper", "Martin", Gender.MALE, LocalDate.of(1971, 7, 1), 6000)
)

enum class Gender {
    MALE,
    FEMALE
}
OUTPUT:
CENTROID: 0
    Patient(firstName=Dan, lastName=Forney, gender=MALE, birthday=1985-09-13, whiteBloodCellCount=5400)
    Patient(firstName=Lauren, lastName=Michaels, gender=FEMALE, birthday=1975-08-21, whiteBloodCellCount=5000)
    Patient(firstName=James, lastName=Larson, gender=MALE, birthday=1974-04-10, whiteBloodCellCount=5100)
    Patient(firstName=Dan, lastName=Ulrech, gender=MALE, birthday=1991-07-11, whiteBloodCellCount=6000)
    Patient(firstName=Heather, lastName=Eisner, gender=FEMALE, birthday=1994-03-06, whiteBloodCellCount=6000)
    Patient(firstName=Jasper, lastName=Martin, gender=MALE, birthday=1971-07-01, whiteBloodCellCount=6000)
CENTROID: 1
    Patient(firstName=Sarah, lastName=Marley, gender=FEMALE, birthday=1970-02-05, whiteBloodCellCount=6700)
    Patient(firstName=Sam, lastName=Beasley, gender=MALE, birthday=1981-04-17, whiteBloodCellCount=8800)
CENTROID: 2
    Patient(firstName=John, lastName=Simone, gender=MALE, birthday=1989-01-07, whiteBloodCellCount=4500)
    Patient(firstName=Jessica, lastName=Arnold, gender=FEMALE, birthday=1980-03-09, whiteBloodCellCount=3400)
    Patient(firstName=Michael, lastName=Erlich, gender=MALE, birthday=1985-12-17, whiteBloodCellCount=4100)
    Patient(firstName=Jason, lastName=Miles, gender=MALE, birthday=1991-11-01, whiteBloodCellCount=3900)
    Patient(firstName=Rebekah, lastName=Earley, gender=FEMALE, birthday=1985-02-18, whiteBloodCellCount=4600)
Here, we use TornadoFX to display the clusters in a ScatterPlot.
import javafx.scene.chart.NumberAxis
import tornadofx.*
import java.time.LocalDate
import java.time.temporal.ChronoUnit


class MyApp: App(MyView::class)

class MyView : View() {
    override val root = scatterchart("WBCC Clustering by Age", NumberAxis(), NumberAxis()) {

                patients.multiKMeansCluster(k = 3,
                    maxIterations = 10000,
                    trialCount = 50,
                    xSelector = { it.age.toDouble() },
                    ySelector = { it.whiteBloodCellCount.toDouble() }
                )
                .forEachIndexed { index, centroid ->
                    series("Group ${index + 1}") {
                        centroid.points.forEach {
                            data(it.age, it.whiteBloodCellCount)
                        }
                    }
                }
    }
}
RENDERED UI:

Aggregating Multiple Fields
Using the Kotlin let() operator, it is easy to take a collection of items and aggregate multiple fields into another "summary" object. Below, we take a collection Email objects and find the distribution of instances of subject and sender.
package org.nield.kotlinstatistics

fun main(args: Array<String>) {

    class Email(val subject: String, val sender: String)

    val data = listOf(
            Email("I make u offer", "[email protected]"),
            Email("Congratulations!", "[email protected]"),
            Email("Your Inheritance is waiting!", "[email protected]"),
            Email("Hey", "[email protected]")
    )

    data class FieldDistributions(val subject: Map<String,Int>, val sender: Map<String,Int>)

    val distributions = data.let {
        FieldDistributions(
                subject = it.countBy { it.subject },
                sender = it.countBy { it.sender }
        )
    }

    println(distributions)
}
OUTPUT:
FieldDistributions(subject={I make u offer=1, Congratulations!=1, Your Inheritance is waiting!=1, Hey=1}, sender={[email protected]=1, [email protected]=2, [email protected]=1})
You can also do various transformations for each field, such as splitting words and lowercasing them before getting a distribution.
package org.nield.kotlinstatistics

fun main(args: Array<String>) {

    class Email(val subject: String, val sender: String)

    val data = listOf(
            Email("I make u offer", "[email protected]"),
            Email("Congratulations!", "[email protected]"),
            Email("Your Inheritance offer is waiting!", "[email protected]"),
            Email("Hey", "[email protected]")
    )

    data class FieldDistributions(val subjectWords: Map<String,Int>, val sender: Map<String,Int>)

    val distributions = data.let {
        FieldDistributions(
                subjectWords = it.asSequence()
                        .flatMap { it.subject.split(Regex(" ")).asSequence() }
                        .filter { it.isNotEmpty() }
                        .map { it.toLowerCase() }
                        .countBy(),
                sender = it.countBy { it.sender.toLowerCase() }
        )
    }

    println(distributions)
}
OUTPUT:
FieldDistributions(subjectWords={i=1, make=1, u=1, offer=2, congratulations!=1, your=1, inheritance=1, is=1, waiting!=1, hey=1}, sender={[email protected]=2, [email protected]=1, [email protected]=1})
Reusing Logic with Extension Functions
Here is another example that demonstrates code reuse using Kotlin extension functions. Here is a data set of white blood cell counts for a sample of patients:
import java.time.LocalDate


data class Patient(val firstName: String,
                   val lastName: String,
                   val gender: Gender,
                   val birthday: LocalDate,
                   val whiteBloodCellCount: Int)

val patients = listOf(
        Patient("John", "Simone", Gender.MALE, LocalDate.of(1989, 1, 7), 4500),
        Patient("Sarah", "Marley", Gender.FEMALE, LocalDate.of(1970, 2, 5), 6700),
        Patient("Jessica", "Arnold", Gender.FEMALE, LocalDate.of(1980, 3, 9), 3400),
        Patient("Sam", "Beasley", Gender.MALE, LocalDate.of(1981, 4, 17), 8800),
        Patient("Dan", "Forney", Gender.MALE, LocalDate.of(1985, 9, 13), 5400),
        Patient("Lauren", "Michaels", Gender.FEMALE, LocalDate.of(1975, 8, 21), 5000),
        Patient("Michael", "Erlich", Gender.MALE, LocalDate.of(1985, 12, 17), 4100),
        Patient("Jason", "Miles", Gender.MALE, LocalDate.of(1991, 11, 1), 3900),
        Patient("Rebekah", "Earley", Gender.FEMALE, LocalDate.of(1985, 2, 18), 4600),
        Patient("James", "Larson", Gender.MALE, LocalDate.of(1974, 4, 10), 5100),
        Patient("Dan", "Ulrech", Gender.MALE, LocalDate.of(1991, 7, 11), 6000),
        Patient("Heather", "Eisner", Gender.FEMALE, LocalDate.of(1994, 3, 6), 6000),
        Patient("Jasper", "Martin", Gender.MALE, LocalDate.of(1971, 7, 1), 6000)
)

enum class Gender {
    MALE,
    FEMALE
}
Say you wanted to find the 1st, 25th, 50th, 75th, and 100th percentiles by gender. We can tactically use a Kotlin extension function called wbccPercentileByGender() which will take a set of patients and separate a percentile calculation by gender. Then we can invoke it for the five desired percentiles and package them in a Map<Double,Map<Gender,Double>>, as shown below:
fun main(args: Array<String>) {

    fun Collection<Patient>.wbccPercentileByGender(percentile: Double) =
            percentileBy(
                    percentile = percentile,
                    keySelector = { it.gender },
                    valueSelector = { it.whiteBloodCellCount }
            )

    val percentileQuadrantsByGender = patients.let {
        mapOf(1.0 to it.wbccPercentileByGender(1.0),
                25.0 to it.wbccPercentileByGender(25.0),
                50.0 to it.wbccPercentileByGender(50.0),
                75.0 to it.wbccPercentileByGender(75.0),
                100.0 to it.wbccPercentileByGender(100.0)
        )
    }

    percentileQuadrantsByGender.forEach(::println)
}
OUTPUT:
1.0={MALE=3900.0, FEMALE=3400.0}
25.0={MALE=4200.0, FEMALE=4000.0}
50.0={MALE=5250.0, FEMALE=5000.0}
75.0={MALE=6000.0, FEMALE=6350.0}
100.0={MALE=8800.0, FEMALE=6700.0}
Kotlin makes it easy to reuse code while remaining nimble, so spend some quality time with the Kotlin Reference to discover features you can leverage for expressing business logic.
Linear Regression
Linear regression is being implemented as well. You can get a SimpleRegression on a Sequence or Iterable emitting Double pairs, for instance.
fun main(args: Array<String>) {
    val r = sequenceOf(
            1.0 to 3.0,
            2.0 to 6.0,
            3.0 to 9.0
        ).simpleRegression()

    //prints the slope "3.0"
    println(r.slope)
}
You can also select the x and y on any arbitrary type T. Below, we plot a regression against sale numbers across calendar dates:
import java.time.LocalDate

fun main(args: Array<String>) {

    class SaleDate(val date: LocalDate, val sales: Int)

    val salesDates = listOf(
                SaleDate(LocalDate.of(2017,1,1), 1080),
                SaleDate(LocalDate.of(2017,1,2), 2010),
                SaleDate(LocalDate.of(2017,1,3), 1020),
                SaleDate(LocalDate.of(2017,1,4), 907),
                SaleDate(LocalDate.of(2017,1,5), 805),
                SaleDate(LocalDate.of(2017,1,6), 2809),
                SaleDate(LocalDate.of(2017,1,7), 2600)
            )

    val regression = salesDates.simpleRegression(
                xSelector = { it.date.dayOfYear },
                ySelector = { it.sales }
            )

    //print slope of regression
    println(regression.slope)
}
Related Projects
- Kmath - Kotlin math API in development
- Apache Commons Math - Math and statistical Java library
- Koma - Scientific computing library for Kotlin
- Krangl - Tabular data wrangling library for Kotlin